Projectopia provides a powerful front-end dashboard for clients to log in to which means that they never have access to the admin side of your WordPress website. Every action that a client needs to take can be accessed through the dashboard, keeping everything simple, secure and accessible.
In this article we’ll run through the basics of the Client Dashboard, and link off to other articles to explain features in more detail.
The Client Dashboard
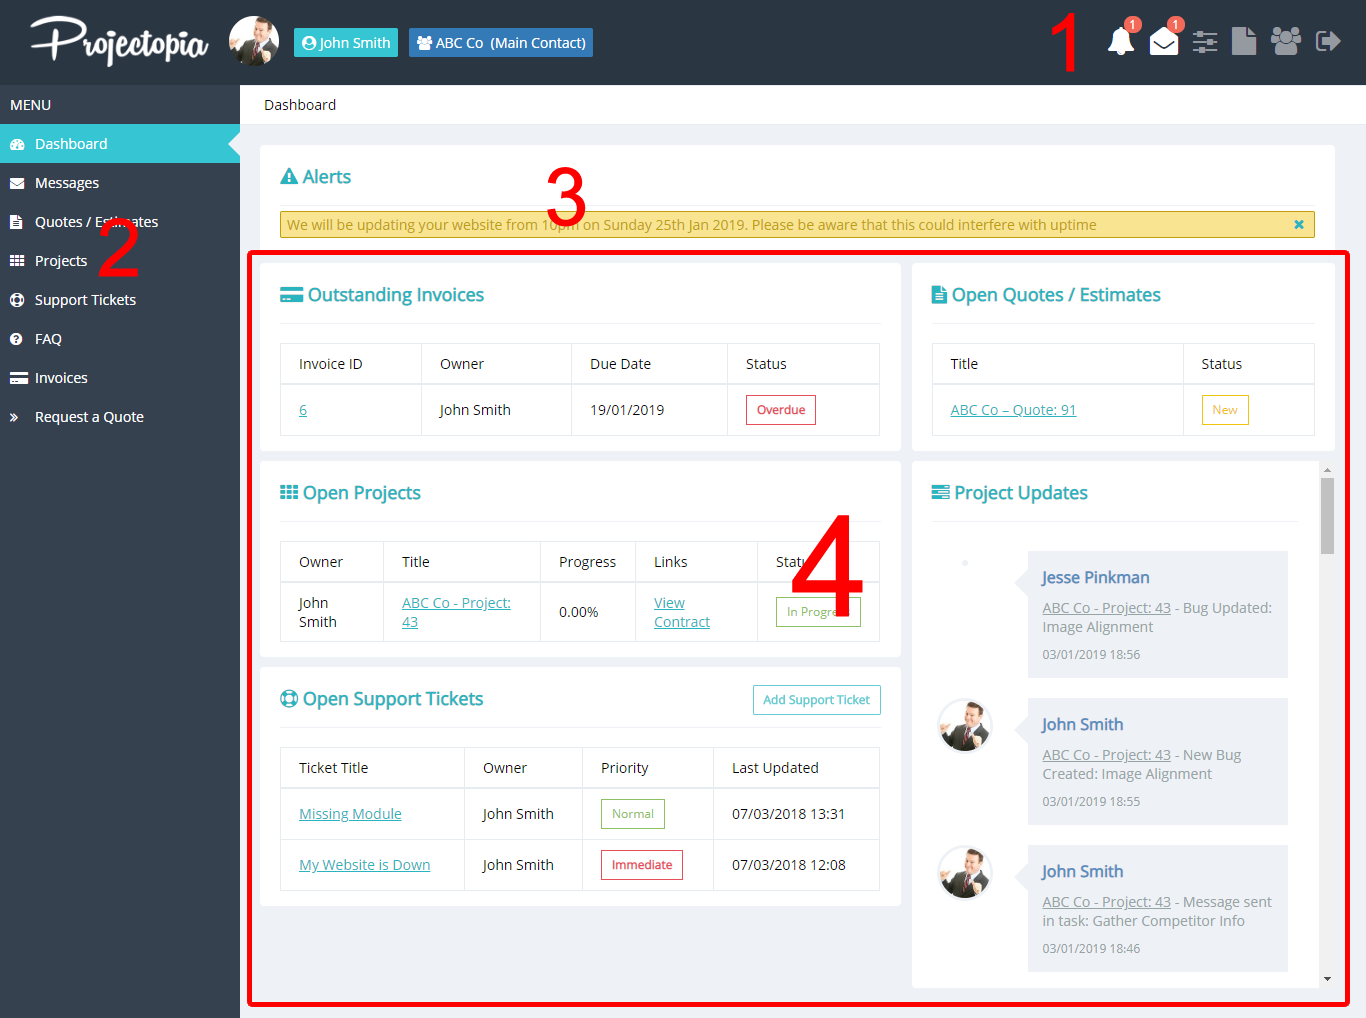
1. The Action Bar
The action bar features links for management of the client account, which we’ll go through here.
Notifications: The notifications system alerts clients to any actions that have been taken on their account. It shows events such as tasks being updated, invoices being sent and tickets being updated. See Client Notifications for more information.
Messaging System: The messaging system allows clients to engage in conversations with admins & team members in single conversations or groups. See Messaging System for more information.
Profile Edit: Clicking the sliders icon allows the client to update their personal and contact details from their dashboard. See Profile, Files & Custom Fields for more information.
Client Files: The file icon allow the client to view files that have been uploaded to their account and shared with them. See Profile, Files & Custom Fields for more information.
Client Contacts: The contacts icon allows the client to add / remove and manage extra logins to their dashboard for other users at their organisation. See Client Contacts for more information.
Log Out: The exit icon will safely log the client out of the dashboard and redirect them to the logout redirect URL that can be defined in the plugin settings.
2. The Main Menu
The main menu in the client dashboard has links to current and past elements such as Projects and Quotes. It also features a widget area underneath the menu links. Widgets can be added to the client dashboard sidebar by going to WP Admin -> Appearance -> Widgets.
3. The Alerts Bar
The alerts bar shows custom alerts that are set by admins or team members. Please see Custom Alerts for more information.
4. The Updates Area
The landing page of the dashboard has been designed to give an at-a-glance view of everything that the client currently has to action. It shows –
- Outstanding Invoices (Unpaid)
- Open Quotes that require acceptance
- Open Projects with links to the project and the project contract
- A Project timeline featuring all updates that have been made in all open projects.
- Open Support Tickets that require a reply.
TIP: The paged dashboard and updates landing page is only available when using the Projectopia dashboard theme. If you are rendering the dashboard in your own theme then it will have a more simple, one page layout for all Projectopia elements. See Dashboard Theme Options for more information.