Dashboard
Projectopia Admin Dashboard provides you with a birds-eye view of the overall happenings with all your projects.
The dashboard page provides you clear insights into the income you were able to generate, status of all your projects, information regarding your open tasks, and the recent updates on the project.
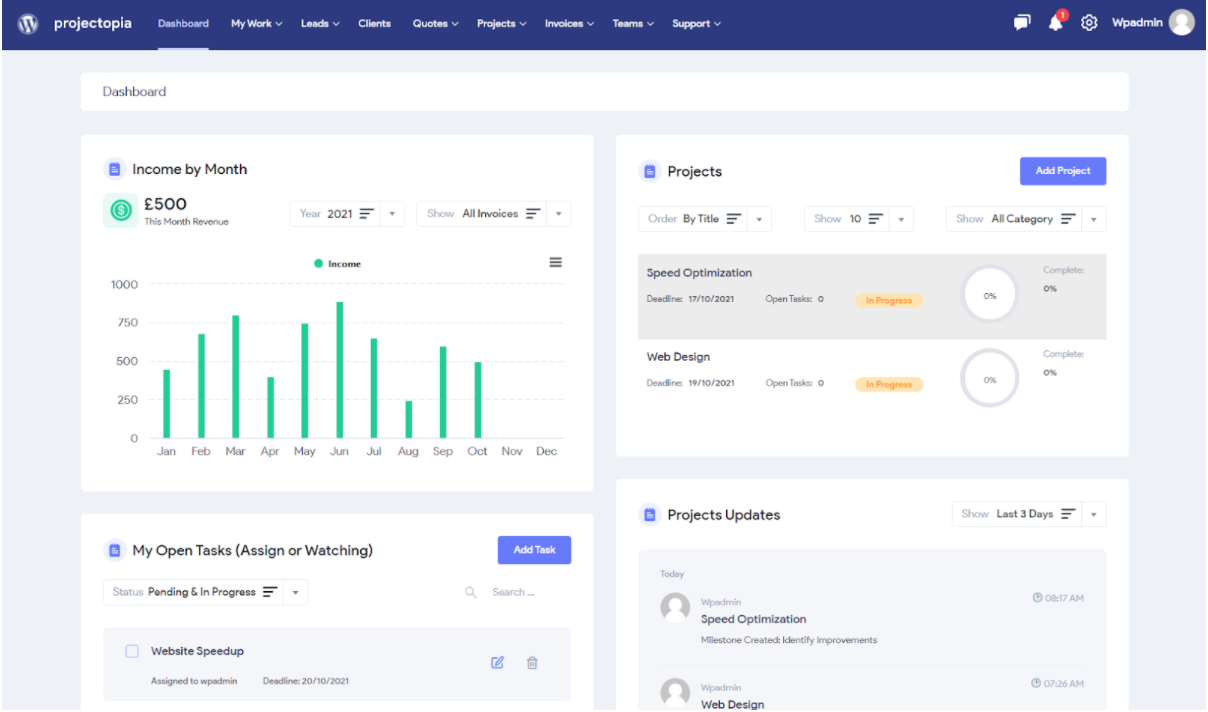
Availability of these informations right on the dashboard page helps you analyze the progress and plan the project more efficiently applying the necessary steps.
Income by Month
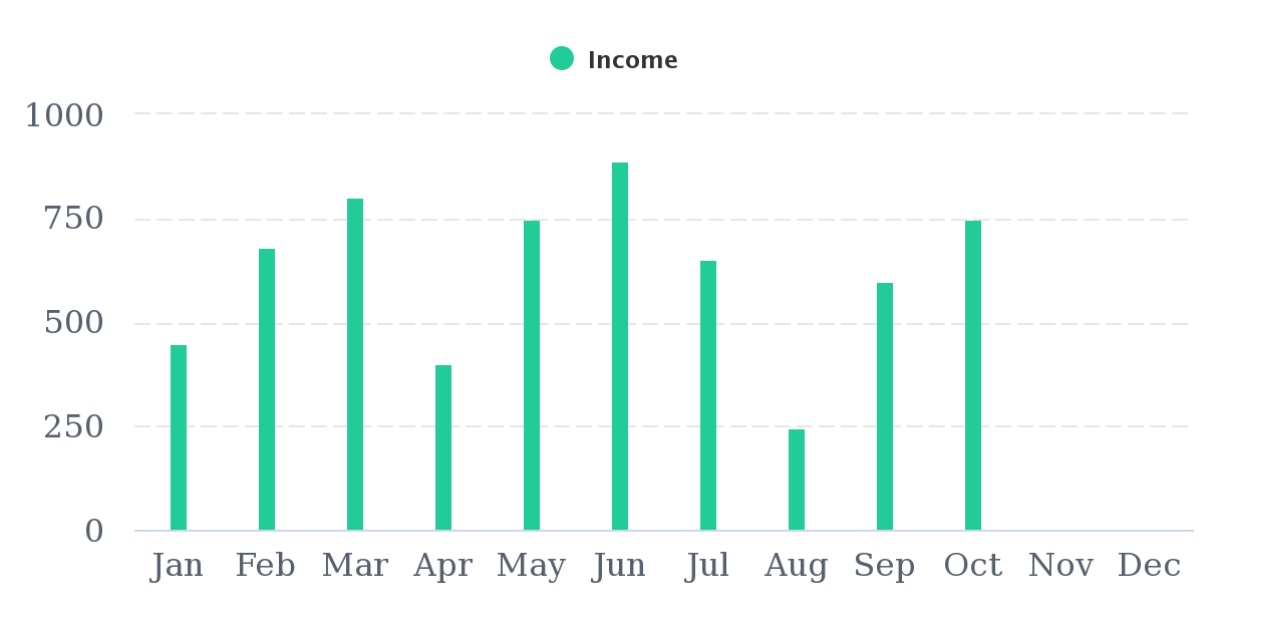
The income by month section provides a comprehensive income report of monthly revenue that your projects were able to generate.
You can view this report using a bar chart. Download the report to your computer as PDF., SVG, PNG, or JPG images.
You can even view the previous 3 years’ data and filter the income to “Only Paid Invoices” or “All Invoices” to get a more clear view of the income.